
Copyright: © 2026 by the authors. Licensee: Pirogov University.
This article is an open access article distributed under the terms and conditions of the Creative Commons Attribution license (CC BY).
This article is an open access article distributed under the terms and conditions of the Creative Commons Attribution license (CC BY).
ORIGINAL RESEARCH
Classification models for assessment of influenza virus A/H1N1 inhibitors
About authors
1 Institute of Biomedical Chemistry (IBMC), Moscow, Russia
2 The Ufa Institute of Chemistry of the Ufa Federal Research Centre of the Russian Academy of Sciences (UFRC RAS), Ufa, Russia
3 Saint Petersburg Pasteur Research Institute of Epidemiology and Microbiology, Saint Petersburg, Russia
Correspondence should be addressed: Leonid A. Stolbov
10 Pogodinskaya St., b. 8, Moscow, 119121, Russia; ur.xednay@alvoblots
About paper
Financing: this research, which details the structure-activity relationship models, was supported long-term by the State Program for Fundamental Scientific Research in the Russian Federation (2021–2030) (Number 124050800018-9). This database was developed as part of the state research project entitled “Kinetic, spectral, luminescent, and theoretical analysis of core intermediates in chemical and biochemical oxidation processes” of the Ufa Institute of Chemistry of the Ufa Federal Research Centre of the Russian Academy of Sciences No. 125020601626-9.
Author contribution: Stolbov LA — data analysis, model building, manuscript preparation; Borisevich SS — idea, database preparation; Gorokhov YaV — scientific literature review for database compilation; Zarubaev VV — providing up-to-date results of biological testing; Tarasova OA — the idea and methodology of research; Poroikov VV- research methodology. Every author contributed to writing and editing the paper.
Received: 2026-01-29
Accepted: 2026-05-10
Published online: 2026-06-15
|
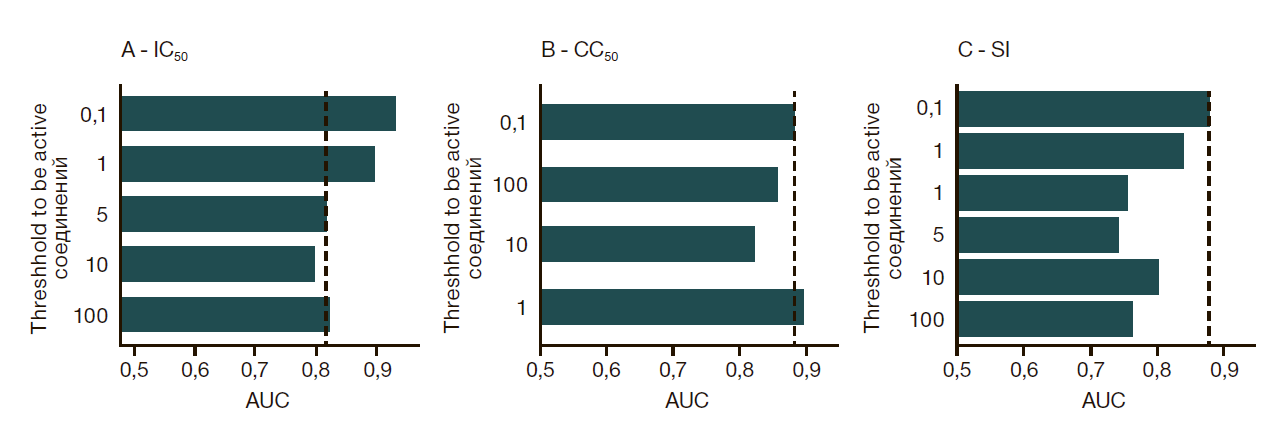
Fig. 1/. The model’s accuracy is measured by the area under the receiver operating characteristic curve (AUC-ROC) during validation. This was tested at different thresholds to identify active compounds for А) IC50 B) CC50 C) SI. The chosen model is marked by the dotted line.
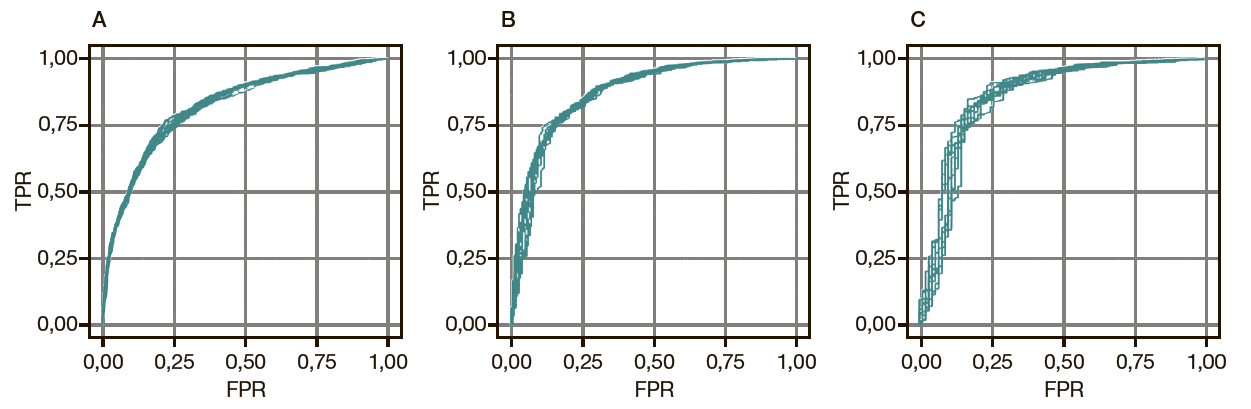
Fig. 2. Validation AUC ROC curves for models based on three thresholds: A) IC50 at 5 μg/ml B) CC50/ at 300 μg/ml, and C) SI at 200
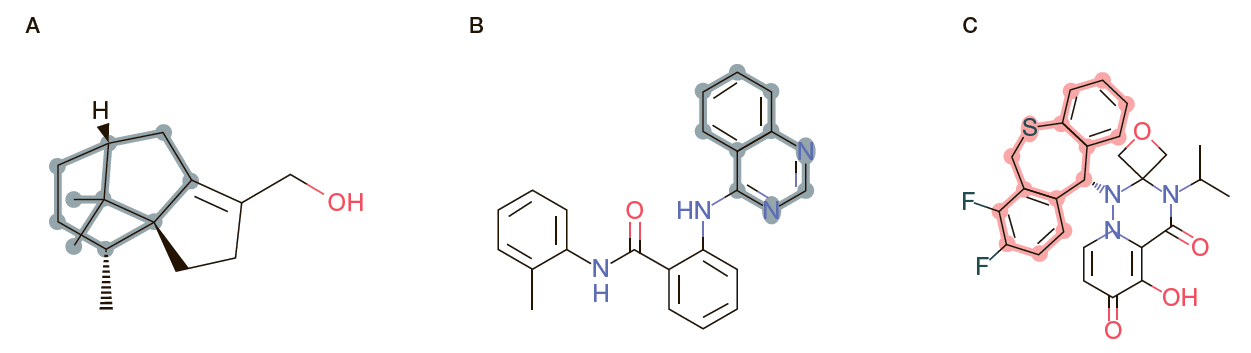
Fig. 3. Structures from an independent test sample: A, B — a dedicated scaffold is found in active (or indeed in any) connections contained in the database; C — a dedicated scaffold is not found in any connection of the database used in training.
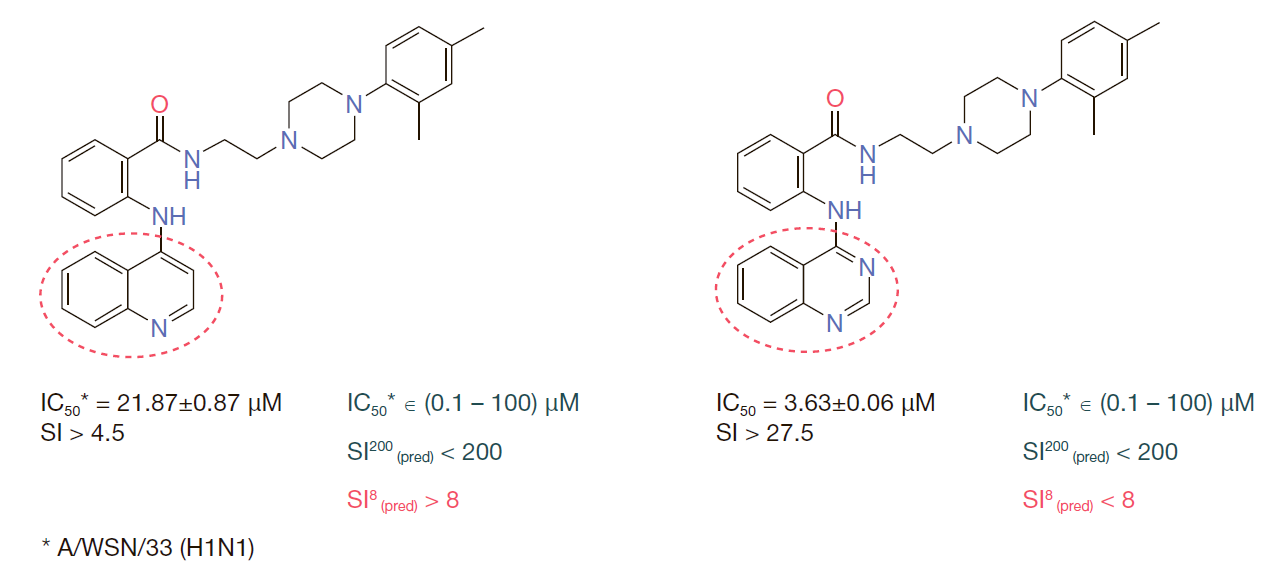
4. Validation of the predictive model. The compounds are described in paper [21]. In the figure, the IC50 values represent the actual experimental data, whereas the SI200 and SI8 values represent the predictions at the thresholds of SI = 200 and SI = 8, respectively.
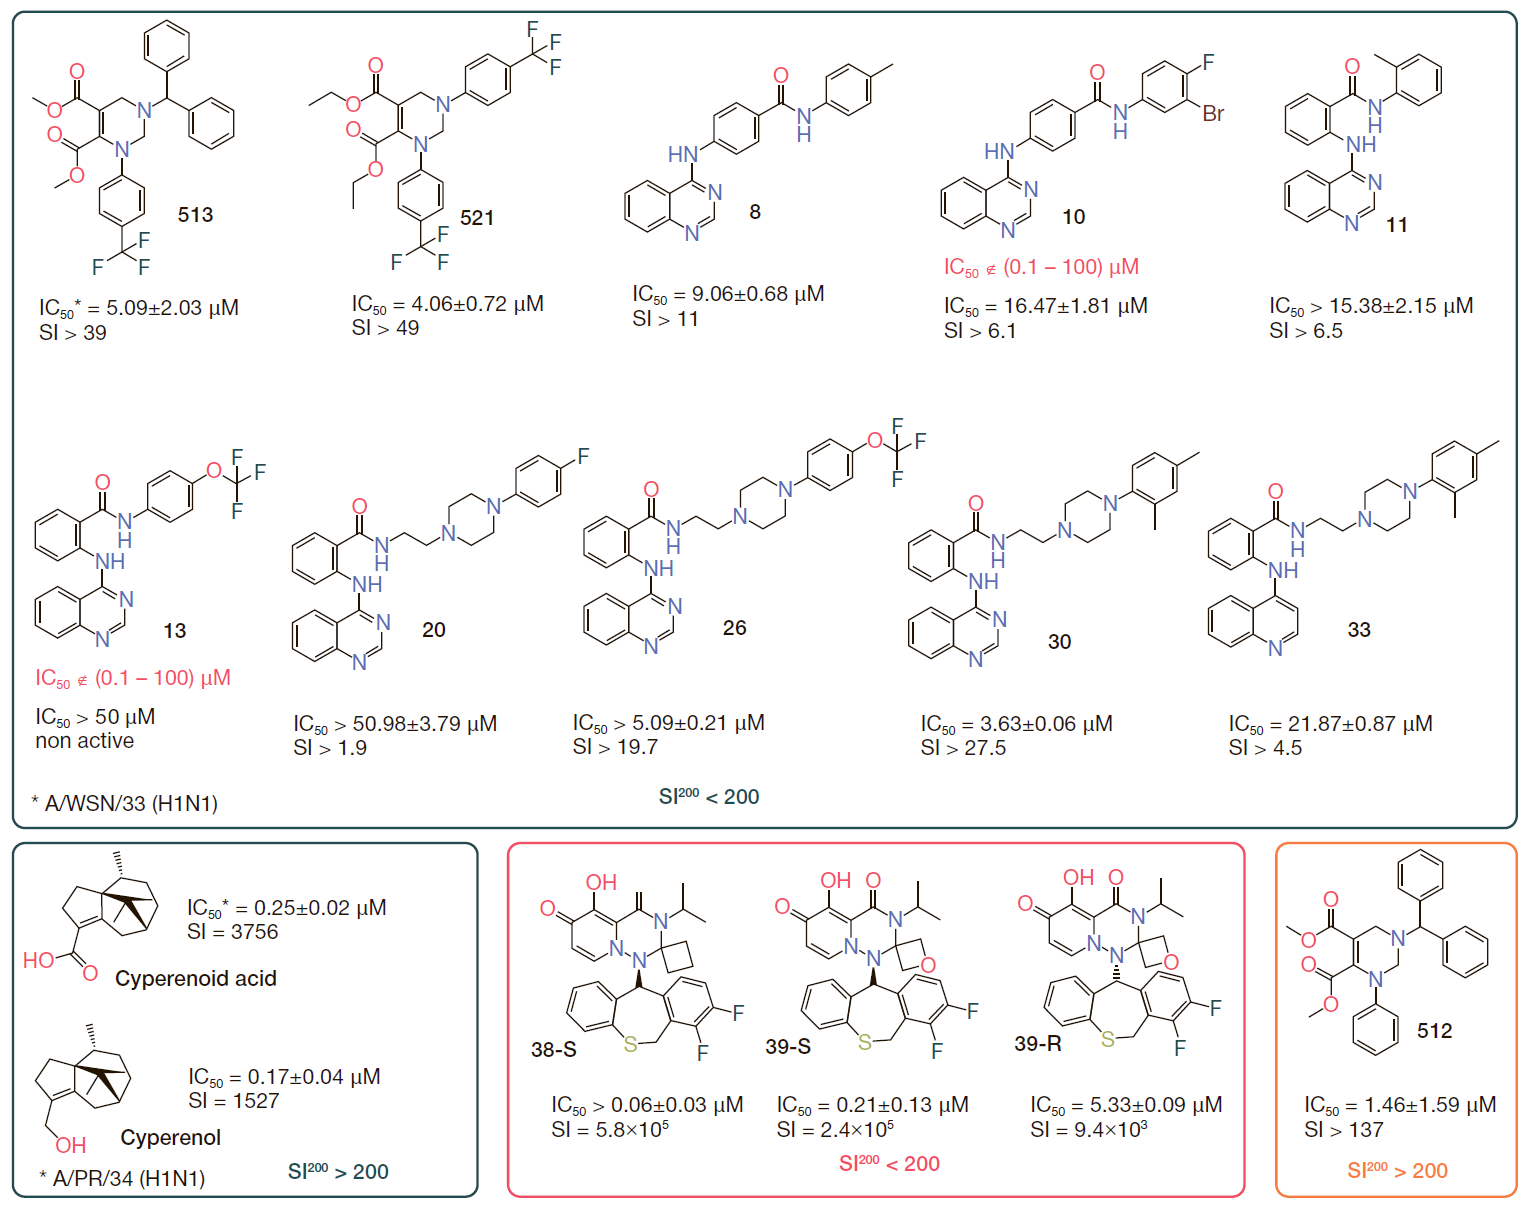
Fig. 5. Validation of the predictive model. The assigned numbers for these compounds are the same as those found in references [19–22]. The experimental results are presented as IC50 and SI in the figure, whereas the SI200 values are based on prediction. Correct predictions are in green boxes. Incorrect predictions are in red boxes. Doubtful predictions are in yellow boxes